A stable debt to GDP ratio
James K. Galbraith spends some time in his new book (The End of Normal) playing around with Willem Buiter’s formula for the debt to GDP ratio (in a 2010 paper for Citigroup entitled, “Games of chicken between the monetary and fiscal authority: Who will control the deep pockets of the central bank?”). I have not yet read that paper. The formula is specified as follows (after Galbraith 2014; Kindle location around 3227):
Δd = -s + d*[(r – g)/(1 + g)]
where: d is the debt to GDP ratio, s is the primary surplus (deficit) as a share of GDP, r is the real interest rate, and g is the rate of GDP growth.
Galbraith specifically examines the potential for a stable/sustainable ratio, which contra the Congressional Budget Office he demonstrates is possible if one challenges the assumptions of growth, interest rates, and inflation rates going forward. Additional points are in order. First, a definition: ‘unsustainable’ refers to a ‘[policy] path … that must be changed eventually.’ Second, sustainability in this context is descriptive, not normative. As long as the ratio ‘eventually stabilizes’, this is enough for our purposes, regardless of the actual level of the ratio. Implicit behind Galbraith’s reasoning is some doubt as to whether the formula provides a reasonable basis for the making of public policy. This is debatable. So where is the utility of this equation?
I suspect that this is an important formula, in particular for the way we think about distributive conflict. That is, I think there is some unique insight from the formula into key institutional relationships in government financing. For the purposes of government financing, in using the formula we must accept, first of all, that debt reduction is a worthwhile endeavor. Let’s say it is, despite the fact that austerity during periods of deflation is an unambiguous error that will prolong a low or negative growth environment.
One of the first lessons from playing around with this formula is that we recognize immediately that there are several moving parts in the battle to reduce the debt burden. One organization (the monetary authority, the fiscal authority) or perhaps one sector (financial markets, households, government) can disrupt the whole process. The Fed could raise interest rates, which could cause refinancing problems for non-financial businesses and even initiate a recession. The Congress could impose further budgetary austerity, which might decrease the primary deficit or might erect an additional barrier to growth. And all sorts of other factors–demographic change, consumer preferences, the savings rate, business sentiment, the development of new technology–could also affect the growth rate.
We can tinker with the assumptions and determine under what conditions we might achieve some sustainability (as Galbraith does). Or perhaps we can try to determine the effort it would take (and by whom) to compel a reduction in the deficit. The three conditions–average or greater growth, low interest rates, and budget restraint–are necessary for achieving a significant decline in the debt to GDP ratio, as I explore below. Pragmatically, it is unclear whether any of the growth factors mentioned could sustain a growth rate greater than the long-term (thirty-year) average (of three percent) for a period of time during which interest rates simultaneously remained negative or low (due to restraint by the Fed in raising rates and a steady rate of inflation) and budgetary austerity managed to put the federal books on a supposedly sounder footing.
So, let’s outline some scenarios of debt reduction.
Tinkering with the assumptions
Let’s use Galbraith’s assumptions in our first example. According to Galbraith, the current debt to GDP ratio is 74 percent (this is in line with CIA World Factbook estimate; the IMF sets the figure at 104.5 percent, which includes external debt obligations). Real interest rates (the interest rate less the rate of inflation) are negative one percent. The primary deficit is five percent of GDP. Let’s say these conditions are fixed in perpetuity. The trajectory of the debt to GDP ratio begins to flatten out in the late 2040s. It passes 120 percent in 2061, and then begins to flatline. Clearly, as Galbraith concludes, this is a stable pathway, irrespective of the level of the ratio.
However, how about we be more slightly ambitious. Let’s try an extreme example. Perhaps we embark on a grand experiment to return to the glorious pre-war years. The debt to GDP ratio target is set at 30%. What intensity of budgetary austerity would be required to bring the debt to GDP ratio (including external obligations) to 30% within the next couple of decades? In other words, how much austerity for how long? Again, we keep real interest rates at the current level of negative one percent.
A fifty percent reduction in the primary deficit per year for ten years would balance the budget. At that time, the debt to GDP ratio would sit at 57.08%. To put this into perspective, the primary deficit currently sits around $850 billion (based on a primary deficit of 5% of GDP, which is currently estimated at $16,800 billion). To achieve savings of $425 billion, we could start by denying the requests of the Air Force for $68 billion and Navy for $58 billion in funding for maintenance and modernization of their fleets. Another source of savings could be found in denying the funds to the US nuclear force (at $23 billion) for the next year (their requests total $355 between now and 2023). For the remaining $276 billion, it is fairly easy to find on the internet other suggestions by officials and citizens for cutting waste out of the defense budget and shuttering various executive departments; the savings from closing the Department of Energy, for example, have been estimated to be around $7.1 billion (see http://www.leagueofamericanvoters.com/cut-100-billion.aspx). These suggestions are plainly ludicrous, but then that’s the point: the goal here is to demonstrate the futility of an exercise of debt to GDP targeting. Even after achieving balanced books (and keeping them there), not until 2040 would we reach the ideal debt to GDP ratio.
Let’s try a scenario that doesn’t require the wholesale and rapid liquidation of government operations. Let’s assume that Congress enacts an annual program of budgetary austerity that decreases the primary deficit (as a share of GDP) by two percent each year, beginning at current levels of 5%. This implies a total freeze in new spending. Now let’s breathe some life into the Federal Reserve, which has been sulking in the corner up to this point due to our fixing real interest rates at -1%. The Fed decides to incrementally increase the interest rate while effectively combating any inflationary tendencies, such that the real interest rate increases by 0.25 percent each year. By 2018, the real interest rate would be zero, and increases by a full percentage point every four years. The figure below shows the annual percentage change in the debt to GDP ratio under this scenario.
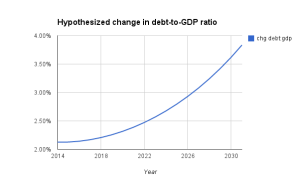
What you find is that the two mechanisms of rising interest rates and budgetary austerity are completely at odds. In fact, the rate of increase in debt to GDP accelerates. This scenario, furthermore, ignores the possibility that a rise in interest rates triggers a contraction, as Galbraith points out. We assume that there are no interactions between the components of the equation; this notion is a fantasy. That is, neither tinkering with the deficit nor the interest rates are supposed to have an effect on the growth rate–this is a bold assumption indeed.
There are many hidden assumptions built in that have not yet been mentioned. For instance, we take it for granted that the organizations responsible for implementing action (cutting budgets, fighting inflation, setting interest rates and thus affecting lending behavior by banks) will be effective. There are no exogenous shocks here, such as a spike in the cost of resources or a war, and no endogenous ones either, like a financial crisis. The necessary assumptions and the implied restraint and efficacy on the part of key organizations and sectors to deliver us to a sustainable growth path are enormous. After you play around with the Buiter formula, debt reduction as a public policy goal becomes even more horrifying.
The likelihood of distributive conflict
I do not think that the formula and recommendations based upon it should be taken as any kind of foundation of public policy decision-making. I do not believe that the appropriate object of our attention and effort should be the debt ratio; more socially-optimal outcomes include improving the public health, public safety, and fostering peace and prosperity in general. Does the debt to GDP ratio get us any closer to achieving any of these objectives in a fiscally sustainable manner? I would argue that as long as the debt to GDP ratio cannot be objectively determined to have any bearing on the likelihood of sovereign default or financial crisis, it should stay in the pages of academic journal articles and white papers. That is, be wary of its application outside those texts, especially if it is used as a political technology.
From my perspective, though, the formula does say a lot about the potential for distributive conflict. Any scenario involving continued austerity, battling inflationary tendencies in the economy, and changing interest rates (as set out in the final scenario above) already implies a situation of distributive conflict between recipients of government services, savers, and the financial sector. The Buiter formula makes this situation obvious. And this can all happen without actually producing a decline in the debt to GDP ratio. So, the potential that efforts at debt reduction merely stoke conflict for the purpose of advancing parochial interests is quite high. This raises an important question: is debt reduction pursued for its own sake, or for other reasons?
Pragmatically, here are some of the key institutional relations that matter for the purposes of debt reduction: budget appropriation processes, the process of interest-rate setting at the Federal Reserve, and the federal bureaucracy (namely, its cooperation with the other authorities and the level of influence and attention of its constituencies). Being a geographer, I am sensitive to the fact that a program of deficit reduction is essentially a series of spatial processes. That is, constituencies will be mobilized, certain organizations will be called upon to implement action, and policies will be decided upon and then enacted in certain locations. There’s quite a lot to work through here–the possibility for intervention in multiple venues exists.
Bottom line
I think that examining the institutional relationships behind macro-economic formulae might be a good entry-point for evaluating the effects of territory/space/place on decision-making. This post has provided only a preliminary look; I am still thinking about the necessary conceptual and methodological foundations for an analysis of distributive conflict. The Buiter formula, though, seems to me an ideal candidate for the repurposing of concepts and models from the field of economics for more critical use. In any case, playing around with the assumptions of the equation makes for a fun if not pessimistic sideshow.


